Abstract
This paper shows the effect of Radiation Induced Attenuation (RIA) on Fibercore fibers used in Fiber Optic Gyroscopes (FOGs). Four fibers from our H1500G-RT radiation tolerant range were used, five fibers of standard HB1500G, five Erbium (Er) doped fibers from Fibercore’s amplifier range plus two alumina only fibers for a reference.
A gamma radiation source is used to show the impact of total dose of 200, 1000 and 2000 Gray. Fibercore’s range of radiation tolerant Polarization Maintaining (PM) fibers were tested and it has been shown that they are all completely suitable for operation in a space environment, with RIA values of <1dB/km in a 20 year operational life in orbit. As expected, the RIA is much higher in Fibercore’s range of non-radiatin tolerant standard PM fibers, with a RIA difference of 50dB/km.
Fibercore’s range of Erbium Doped Fibers (EDFs) were also tested since these are often used as Anisotropic Spontaneous Emission (ASE) sources in FOGs. It is shown which of Fibercore’s products are most suitable for a space environment and the impact of RIA on performance as an amplifier is discussed. The dopants and their concentrations are known and correlations with the key constituents, Germanium, Aluminium, Erbium and Phosphorous are demonstrated. Hence the optimum fiber for a given application environment can be selected.
Introduction
The range of applications for Fiber Optic Gyroscopes (FOGs) has been constantly growing with many applications in ground based vehicles, marine and aerospace sectors. Some of these applications require the gyroscopes to operate in an environment where radiation exposure is expected. Certain defence roles require equipment to withstand a “flash” radiation exposure where a high radiation dose rate is given over a short period of time. Space missions however, can require the gyroscopes to operate over years or even decades whilst being exposed to a lower but more continuous dose rate.
As FOG technology has matured over the last decade, it has gained better acceptance in high value space projects such as satellites and other space vehicles. The inherent high reliability, high accuracy and relatively low weight of a FOG have enabled a growing trend of FOG use in satellites. Satellites require gyroscopes for altitude control, to ensure correct orientation over the lifetime of the project. Failure to maintain orientation can lead to sensors pointing in the wrong direction or incorrect positioning of the satellite in orbit, both of which can cause mission failure.
The re-emergence of microsatellites could create a paradigm shift in the number of space vehicles launched. Microsatellites are often easier to justify commercially than larger satellites due to their lower costs, shorter development times and more focused missions. Currently, microsatellites can be piggybacked onto a shared launch vehicle making the launch more affordable but for the future, organizations such as Virgin Galactic, the Canadian Space Agency, Interorbital Systems and Microcosm Inc are all targeting the launch of microsatellites [1]. This could make a dramatic difference to the accessibility of space and increase the requirement for space qualified FOGs.
The design of a FOG needs to be considered carefully for space applications as not all optical fibers are radiation tolerant. The main gyroscope coil is often made from Polarization Maintaining (PM) fiber where some of the chemical components can be sensitive to radiation exposure and erbium doped fibers, commonly used as Anisotropic Spontaneous Emission (ASE) light sources, can also be highly sensitive to radiation. Within this paper, we demonstrate the use of Fibercore’s extensive range of optical fibers to give a clear understanding of how each chemical and their relative combinations and concentrations affect the Radiation Induced Attenuation (RIA).
Subscribe for Insights!
Register to receive Fibercore's latest key updates, events and relevant industry news
straight to your inbox!
Theory
For space based applications, there are various models used to simulate space radiation that a satellite might encounter in Earth orbit. The exact model required depends on the altitude, orbital path and whether the satellite is functioning over a solar maximum or solar minimum. For Earth orbits, the standard radiation belt models AP-8 [2] and AE-8 [3],[4] are used. These models describe the protons (AP-8) and electrons (AE-8) which are trapped by the Earth’s magnetic field and form the Van Allen belts. These trapped particles originate from the solar wind and galactic cosmic rays, as indicated in Figure 1.
In defence applications, where the fiber is expected to survive the radiation effects of a nuclear event, there is a sudden surge of γ-rays, primary charged particles (for example, protons and electrons) and neutron radiation.
Due to the wide range of radiation types and relative intensities, it is difficult to set up an experiment that can accurately simulate the space environment on a modest budget. It would be preferable to use protons to simulate radiation effects but access to large scale proton accelerators are required. Subsequently, 60Co is commonly used due to the ease of access and low cost of use for testing. γ-radiation from 60Co is suitable for simulating the effects of ionizing events. However it does not correctly simulate non-ionizing effects related to high energy protons colliding and displacing lattice atoms [5]. Nonetheless, Wijnands et al. have shown that the RIA of a pure silica core fiber exposed to various high energy particles is similar to the RIA of the fiber when exposed to γ-radiation from 60Co at a suitable dose rate [6].
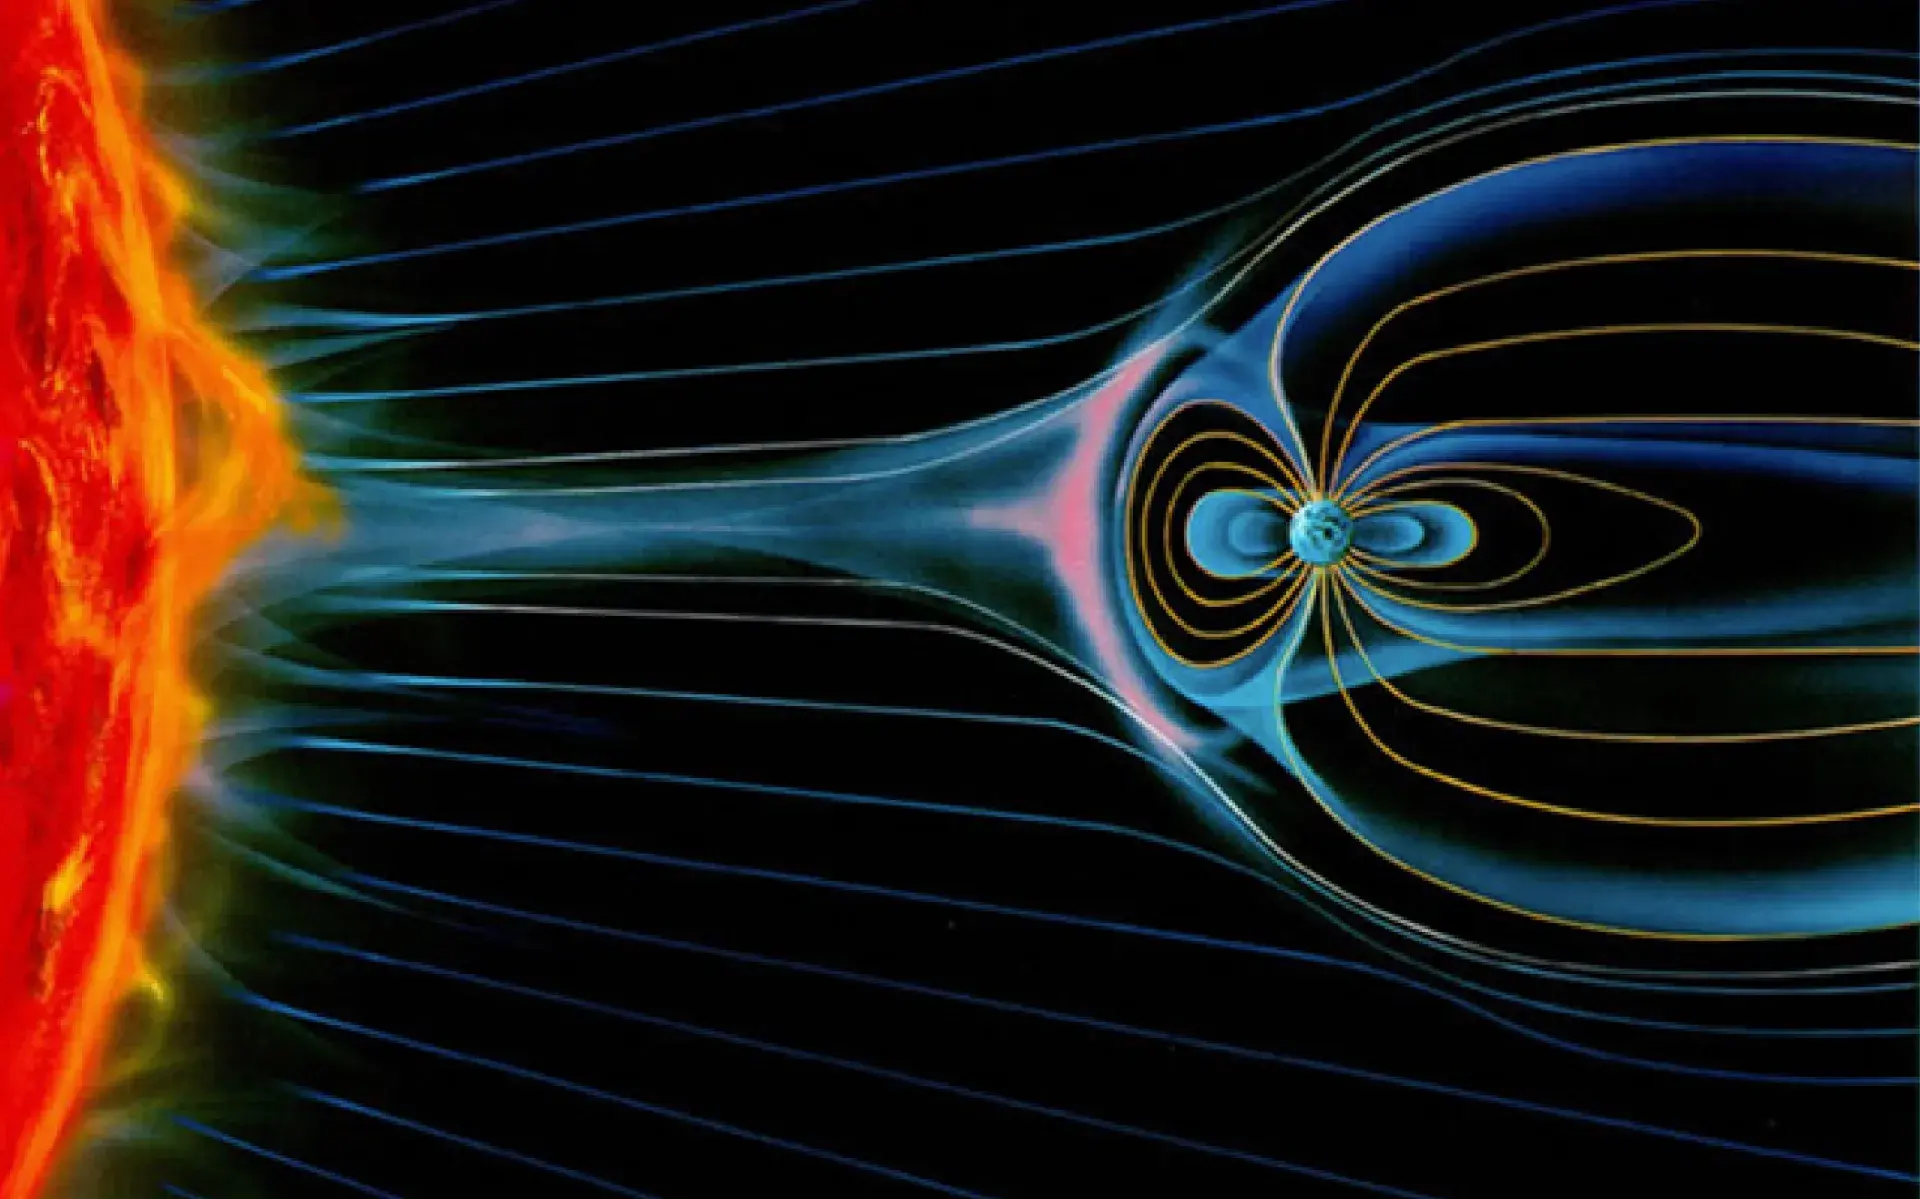
Figure 1: Schematic of the Earth’s Van Allen belts, showing the effect of solar wind. [Credit: NASA]
Although various radiation models for space flight exist and a significant amount of research has been conducted to understand the effects of radiation, it is difficult to extrapolate theory to experimental results, particularly in complex systems such as FOGs. Subsequently, the only effective method of understanding the radiation behaviour of a complex system is to experimentally test the device and the individual components.
As an indication on the previously published research, Table 1 gives a brief outline of the chemicals used in fabricating optical fibers and their previously published results.
| Chemical | Function in an Optical Fiber | Effect of Radiation |
|---|---|---|
| Silica | Forms the bulk of most optical fibers. The cladding is typically manufactured using silica and the core host matrix is often based on silica. | At very high dose rates, RIA is observed at <1300nm with stronger RIA towards shorter wavelengths. The cause is believed to be due to the combination of Ultra Violet (UV) absorption, two visible absorption bands and a Near Infra-Red (NIR) band related to Self-Trapped Hole defects (STH). [7] |
| Germania | Typically used within the core of a fiber to create a localized increase in refractive index which allows light to be guided within the core. | It is suggested that the absorption bands are similar to the silica fiber but with the STH defects modified by the presence of germania, leading to a slight reduction in NIR attenuation and slightly elevated attenuation in the visible region.[7] |
| Phosphorus | Can be used in the inner-cladding region to create a lower melting temperature to assist with core circularity. | Phosphorus has a strong effect on broadband RIA. This is attributed to Phosphorus Oxygen Hole Center (POHC) defects at in the visible region and P1 defects at 1310nm and 1550nm. [7] [8] |
| Boron | Forms the ‘Bow-Tie’ stress applying part in PM fibers. | Increases RIA, particularly at shorter wavelengths. [8] |
| Erbium | Forms the active element in ASE light sources and fiber amplifiers. | Erbium is difficult to evaluate alone as it is often incorporated into the core of an optical fiber through the use of a Ge-P silica matrix with alumina used as part of a solution. S. Girard et Al [9], suggest that the erbium concentration has little or no effect on the RIA. |
| Aluminium | Forms a shell around the erbium atoms to prevent them from clustering, improving optical efficiency. | Aluminium is known to have an effect on the RIA, possibly related to Al-hole centers. [10][11]. |
By international research standards, the level of research into the radiation effects on optical fibers is relatively small and not particularly thorough. A part of the reason for this is due to the wide range of compositions that can make up an optical fiber, for example, Single-Mode (SM) fibers are often made from silica, germania and/or fluorine, PM fibers often also contain boron and phosphorus and EDFs (used for light sources and amplifiers) can additionally contain Erbium and alumina. Due to the wide range of chemicals used and varying concentrations that they are used in, the number of possible combinations are large and subsequently is it difficult to access fibers with the suitable combinations to give detailed and rigorous results.
Experimental Setup
The gamma irradiation facility offered by AMEC at Harwell, Oxfordshire, England was used for this testing. The temperature was 23-25oC throughout the test. Three total radiated doses of gamma radiation were used, 200, 1000 and 2000 Gray, each with 4 different dose rates, 50, 150, 250 and 500 Gray per hour. The values were taken as a nominal total dose level for a satellite life of 20 years in geostationary orbit [12] which used OMERE 2.0 modelling [13] and also 5 and 10 times this level. The tolerance on the radiation levels was within 20%. Most of the samples were radiated passively without active monitoring of light, the attenuation induced loss from the radiation was measured by testing the fiber with a PK2500 fiber test system across the wavelength of interest, before and after testing. The damage due to ionising radiation is seen in the increased attenuation. RIA was calculated by subtracting the unradiated attenuation values from the post radiated value at each wavelength. Control lengths of 100m of each unradiated fiber were kept.
Three of the radiation tolerant fibers were measured actively using a super luminescent diode 1530nm source split using a four-way fiber power splitter to 3 fibers under test, and one to monitor the source power. The optical power was monitored using a four channel optical power meter UDT S490 using the four analogue outputs into a Pico-logger PT104 to a laptop PC. Samples were taken every 30 seconds during the radiation and the annealing.
For live testing, the radiation profile used was 40 minutes at 150 Gray per hour followed by a minimum of 120 minutes of no radiation then a further 40 minutes of radiation, giving a total radiated dose of 200 Gray.
The active spools used a length of 1km in order to ensure that there was enough attenuation to be measurable ‘live’ with the fiber wound over only half of the spools width to give better uniformity of irradiation. The other samples used 100m spool lengths for 200 Gray and 20m lengths on smaller spools to ensure dose consistency on the 1000 and 2000 Gray levels.
The positioning of the spools is shown in Figure 2. The four gamma sources and the 3 spools are positioned to give a uniform field. Fiber tails were led away from the sources and out of the test cell to test equipment outside for the active ‘lit’ tests.
The ‘unlit’ spools were placed in exactly the same positions as the ‘lit’ spools and the dose rate repeated the following day. The EDFs were measured several months post radiation, so they will have completed any thermal annealing that is viable at room temperature. The lit fibers were measured for RIA within 24 hours, the unlit ones were measured within 96 hours and the passive (and higher dose) tests were measured within a week. Hence, further annealing may occur post these results.
High Birefringent (polarization maintaining fibers)
The samples were all designed for operation at a nominal wavelength of 1550nm. All of the PM types were designed for gyroscope use and were 80μm in diameter.
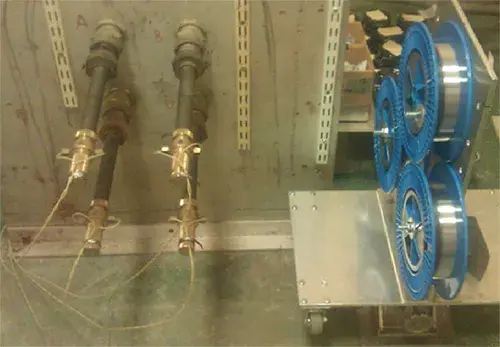
Figure 2: The arrangement of the gamma sources and the fibers under test.
| Fiber | NA | Conditions |
|---|---|---|
| Radiation tolerant polarization maintaining | 0.13 | 0.17 | 0.20 | 0.23 | Active and passive, 3 radiation total dose levels |
| Standard polarization maintaining | 0.14 | 0.16 | 0.18 | 0.21 | Passive only, 200Gray total dose level |
All of these fibers above use germania for the core doping, however the radiation tolerant versions are completely free of phosphorous. They were deliberately chosen to show a range of Numerical Apertures (NA) and hence core doping levels.
Erbium doped fiber for amplifiers
These fibers contain germania, alumina and Erbium in the core in differing amounts to give the required absorption in the 1550nm region from Erbium. Traces of other elements may also be present. The samples were all 100m in length and the total dose level was 200 Gray at 2 Gray per hour.
The fibers differ in the amount of Erbium present, as can be seen in the absorption at 1550nm, and hence the length of fiber which gives 100dB absorption. The 100dB length is a useful guide as to how long a length of fiber is needed for a real amplifier or an ASE source. This also normalizes the number of Er ions in each length of fiber.
The attenuation of the fiber was measured both before and after radiation at a wavelength of 1310nm. This wavelength was used as the fiber has high absorption at 1550nm. The absorption and emission spectra were taken before and after irradiation.
| Fiber Type | Preform | Absorption at 1531nm (db/m) | 100db Absorption Length (m) |
|---|---|---|---|
| I-4 (980/125) | 30815 | 6.395 | 15.64 |
| M-5(980/125) | 30511 | 7.16 | 13.95 |
| I-6 (980/125) | 30889 | 7.564 | 13.22 |
| M-5 variant | 30947 | 16.5 | 6.05 |
| I-25 | 50595 | 25.5 | 3.66 |
Two further fibers which had only alumina doping (no Erbium or other dopants) were also tested. The fibers were fabricated to have a high level of Al and a low level of Al between the M-5 and M-5 variant used in the Erbium fibers.
Experimental Results
High Birefringent (Polarization Maintaining Fibers)
(a) Radiation Tolerant Polarization Maintaining Fiber
| Fiber Type | Radiation Conditions | Total Dose | 200 Gray | 200 Gray | 200 Gray | 1000 Gray | 2000 Gray |
|---|---|---|---|---|---|---|---|
| Dose Rate | 150 Gray/hr ‘lit/ live’ | 150 Gray/hr ‘unlit’ | 50 Gray/hr | 250 Gray/hr | 500 Gray/hr | ||
| Preform | NA | ||||||
| HB1500G/033 | 32867 | 0.13 | 0.96 | 0.85 | 1.55 | 2.85 | 6.89 |
| HB1500G-RT | 32438 | 0.17 | 0.65 | 0.86 | 0.62 | 2.00 | 3.46 |
| HB1500G/SB-001 | 52586 | 0.20 | - | - | 0.33 | 3.52 | 5.23 |
| HB1500G/025C | 51990 | 0.22 | 2.11 | 2.36 | 2.18 | 4.04 | 17.2 |
By comparing the RIA values for the three different dose rates totalling 200 Gray, there does not seem to be a consistent impact of dose rate across the fibers. Single wavelength attenuation values at the expected operating wavelength of 1550nm are shown above but full wavelength results were taken and are shown in the following figure. The accuracy of the attenuation measurement is ± 0.1dB/km.
The impact of RIA is more significant at shorter wavelengths and from the intercept with the Y axis, it can be seen that the low wavelength impact is also close to linear with total dose rate. The operating wavelength range can be clearly seen, above the cut-off wavelength of 1360nm. The apparent increased RIA in the 1300nm region is an artifact of the cut-off and is not real.
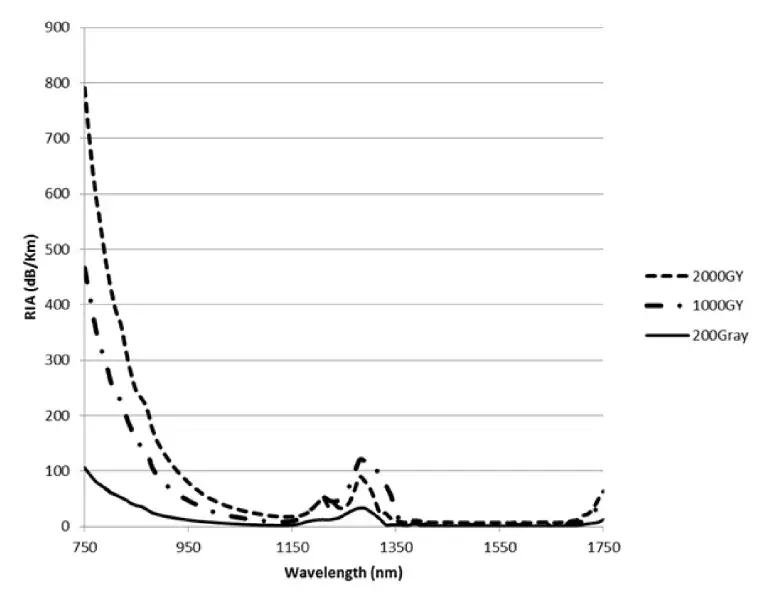
Figure 3: The impact of total radiation dose on the attenuation over wavelength of the same fiber, HB1500G/033.
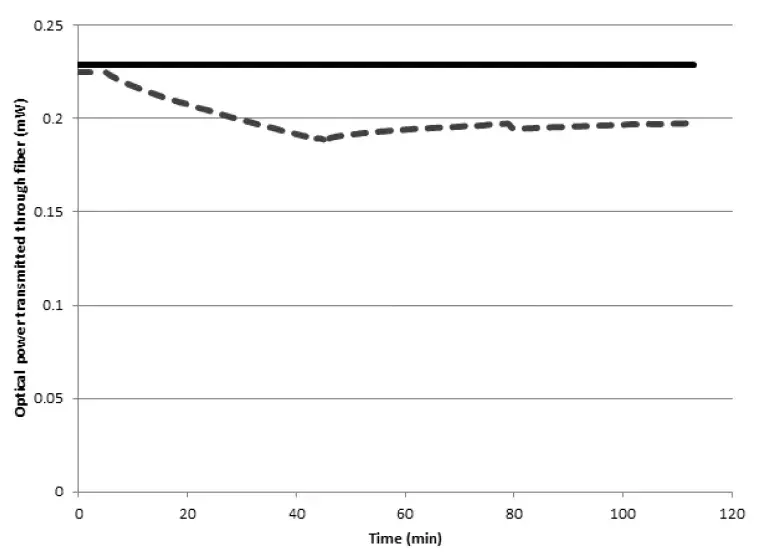
Figure 4: Active monitoring of the attenuation of the HB1500G/033 fiber during and after irradiation. Solid line showing the optical power of the monitored light source and the dashed line showing the optical power of the irradiated fiber.
Figure 4 shows one of the fibers monitored live over 40 minutes of radiation at 150 Gray per hour followed by nearly 60 minutes of anneal. This is the second of two applied doses giving a total of 200 Gray. The optical source power was constant throughout, as can be seen by the top line. The attenuation can be clearly seen to increase gradually (thus reducing the received power) during the radiation and then the attenuation reduces gradually when the radiation stops, but there is clearly residual attenuation. The anneal is potentially due to both temperature and ‘photo-annealing’ with the presence of the light signal. There are two small features of note where the received light changes, both towards the end of the radiation and in the middle of the anneal. These are both believed to be minor relaxation of fiber loops with the 1km length of fiber.
The beat-lengths of the Highly Birefringent (HiBi) fibers were measured pre and post radiation. No change outside of experimental error was found.
(b) Standard Polarization Maintaining Fiber
| Fiber Type | Serial | NA | Cut-Off Wavelength (nm) | RIA at 1550nm (dB/km) | RIA at 850nm (dB/km) |
|---|---|---|---|---|---|
| HB1500G | 52836 | 0.14 | 1291 | 54 | 108 |
| HB1500G | 52816 | 0.16 | 1271 | 58 | 117 |
| HB1500G | 52803 | 0.18 | 1423 | 63 | 120 |
| HB1500G-HI | 51657 | 0.21 | 1379 | 84 | 175 |
| HB1500G-HI | 51180 | 0.21 | 1488 | 58 | 178 |
The standard PM fibers were only radiated at 200 Gray since it was known that they would exhibit high RIA.
Erbium doped fiber for amplifiers
| Fiber Type | Serial | Absorption at 1550nm (dB/m) | 100dB absorption length (m) | RIA at 1310nm (dB/km) | RIA per 100dB absorption length (dB) | Al to Er ratio in the doping solution |
|---|---|---|---|---|---|---|
| I-4 (980/125) | 30815 | 6.395 | 15.64 | 7193 | 112 | 363 |
| M-5(980/125) | 30511 | 7.16 | 13.95 | 835 | 11.8 | 71 |
| I-6 (980/125) | 30889 | 7.564 | 13.22 | 6363 | 84.1 | 266 |
| M-5 variant | 30947 | 16.5 | 6.05 | 622 | 3.75 | 9.2 |
| I-25 | 50595 | 25.5 | 3.66 | 7559 | 27.6 | 75 |
| Al high doping | 32620 | - | - | 5394 | - | - |
| Al low doping | 32880 | - | - | 2865 | - | - |
It can be seen from the table above that the RIA (dB/km) does not follow the absorption which is designed by the Erbium density, and hence the level of Erbium clearly does not impact the RIA directly. This would suggest that the best fiber for space application would have the lowest value of Al to Er ratio, as this would provide the most Erbium with least attenuation. This simultaneously optimises the performance of the fiber whilst providing the longest working lifetime in space.
Analysis and Discussion of Results
Polarization maintaining fiber
(a) Radiation tolerant polarization maintaining fiber
The radiation tolerant PM fiber has been scaled to show the RIA per Gray and plotted against the NA of the fiber. Error bars are added for one data set only, in order to not clutter the graph, but all have very similar tolerance levels; ±20% on the total dose and ±0.005 on the NA. The data illustrates a number of key points. For the lowest NA values it suggests that the attenuation begins to saturate since the highest doses are at the lower range, but this does not extend to the highest NAs. Although it is tempting to see an optimum NA at around 0.17 to 0.2 especially on the two highest total doses of 1000 and 2000 Gray, when the scale of the tolerances are assessed this can be seen to be potentially spurious. In order to confirm this effect, many more samples would be needed and the dose rate must be constant. This experiment does not meet those conditions.
The germania doping density causes the change of refractive index in the core which guides the light, [14], and the NA is proportional to the square root of the refractive index difference [15], hence NA2 is proportional to germania content. If the RIA is affected only by the germania doping density it can be expected to rise with the square of NA, but the R2 value (a common measure of graphical correlation from 0 to 1) from a plot of all the points (not shown) was less than 0.3. However, it is easy to see that the highest NA value was most damaged by the radiation at all the total dose levels. This additional scatter to the general trend indicates that there is more than the effect of germania alone here.
If photo-annealing had a significant impact then all the attenuation values in the results table, found under section ‘a’ of High Birefringent, within Experimental Results, would be higher for the unlit fibers. In fact, two are higher by 0.2dB/km and one is actually reduced by 0.1dB, hence the maximum impact of photo-annealing is 0.2dB/km. The received light levels were in the range of 2 to 24μW, with the highest power level in the fiber showing worsened attenuation, not photo-annealing. Since the test accuracy of the RIA is within 0.1 to 0.2dB/km we cannot assume photo-annealing but simply repeatability error. Annealing is clearly happening from the monitored ‘live’ result, but the mechanism is therefore assumed to be due to thermal effects.
(b) Standard HiBi fibers
Figure 6 showing the RIA with wavelength is particularly interesting, firstly in that the cut-off wavelengths can clearly be seen and secondly in the impact this has on the RIA values in the operating region of 1550nm. All of the fibers show a gradual increase in RIA above the cut-off wavelength.
It is accepted that using phosphorous in the inner cladding [16] causes high levels of RIA because the optical mode is partially transmitted in the cladding. The two fibers 51657 and 51880 have identical NA and hence doping levels, but are at different extremes of cut-off wavelength, namely 1379nm and 1488nm. This dictates a different mode field profile and proportion of the fiber power being carried in the cladding. The fiber that has the larger mode field (51657) shows an understandably larger RIA. However, the RIA at the wavelength of 850nm where the light is only carried in the core follows the variation expected with NA (i.e. Ge doping): RIA increases with increased levels of germania doping.
The effect of phosphorous can be seen from Figure 7. The radiation tolerant fibers contained no phosphorous and the standard HiBi fibers contained phosphorous in the inner cladding. It can be seen that there is a significantly higher level of RIA in the standard HiBi fibers compared to the radiation tolerant fibers. Hence, the radiation tolerant fibers have much superior performance in use.
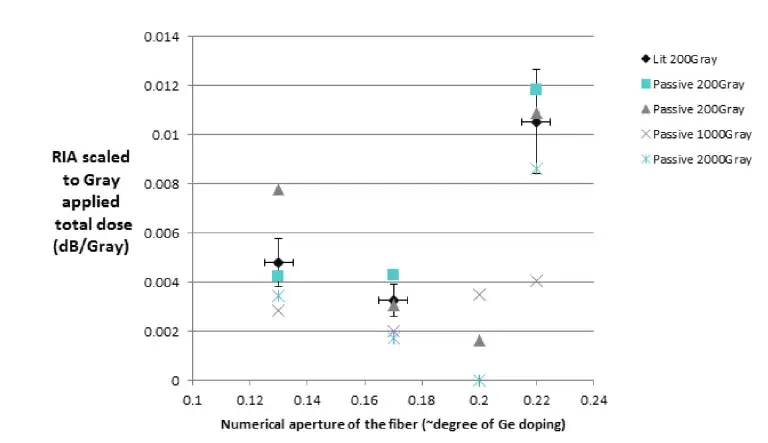
Figure 5: Distribution of the RIA with NA of the fiber for the radiation tolerant fibers, for all dose levels and rates
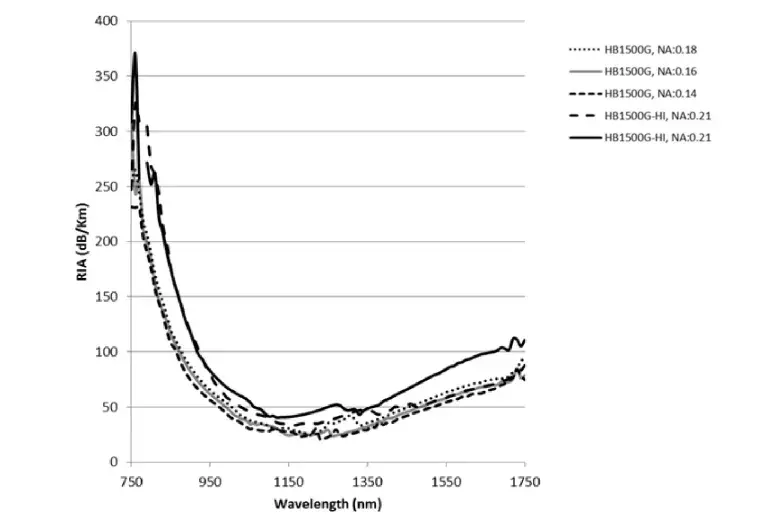
Figure 6: The RIA of standard PM fibers over wavelength.
Erbium doped fibers
(a) Doping density variations
Many EDFs are fabricated using a process called solution doping [17] to add the rare earth element. In EDFs that contain only Erbium, the Erbium ions can cluster together which limits the gain and efficiency of the fiber. To avoid Erbium clustering the fibers must include enough alumina to form a solvation shell around the erbium ions [18]. However, it is also known that changes to the glass host matrix, particularly the introduction of free alumina ions, induce high RIA [12]. This is due to the formation of color centers at those points [19]. Hence, it is necessary to avoid excess alumina. In forming the solvation shell around the Erbium, the aluminum ion is no longer a free defect able to become a color center, therefore reducing the RIA and implying an optimum ratio of alumina to Erbium for minimal radiation damage, whilst retaining the fiber gain and efficiency performance. This is shown in Figure 8 by taking the RIA in 100dB absorption length (thus normalizing the Erbium density of the fibers) against the ratio of Al/Er in the doping solution. The above argument of the aluminum no longer having a bond available to create a defect in the presence of Erbium is confirmed by the alumina only fibers. Erbium and alumina doped M-5 and M-5 variant showed RIA dB/km 622 and 835 respectively, yet on its own this low alumina level showed 2865dB/km.
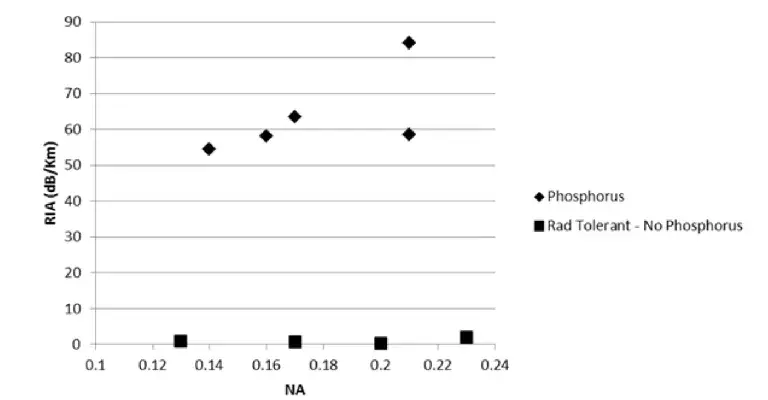
Figure 7: the RIA of standard polarization maintaining fibers (HiBi) compared to radiation tolerant, phosphorus free fibers.
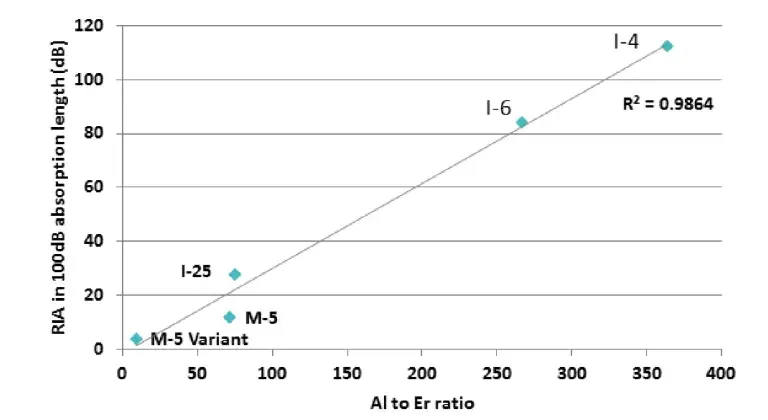
Figure 8: Alumina to Erbium ratio vs. RIA in 100dB absorption length.
Clearly, low alumina is most desirable since this would change the glass matrix the least whilst still protecting the Erbium ions. There is no direct effect of the Erbium itself.
The best fiber for a user (the least RIA for the 100dB absorption length) is the variant of the M-5 design and the next is the M-5 standard design. The I-25, which can be used as an ASE source for a fiber gyro, is the next best.
It has been proposed that there is an effect of germania on the host matrix. Germania is added to the fiber in the fabrication process alongside silica in the form of germania tetrachloride (GeCl4). A ratio of silicon tetrachloride (SiCl4) to the total of SiCl4 and GeCl4 is taken. The density of germania is then considered, so division by the core area is necessary. It has been previously demonstrated that there is an inverse relationship between RIA and germania density [20].
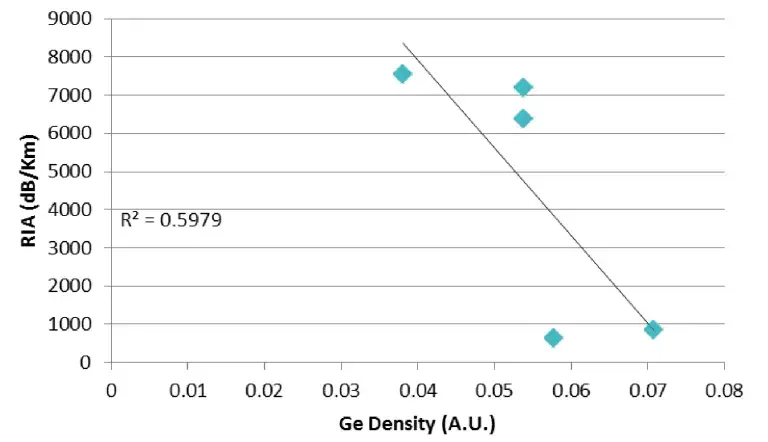
Figure 9: Germania density vs. RIA for EDFs.
The relationship is relatively weak, but is repeated here with our results. This is the opposite correlation seen in the PM fibers, but with a similar scatter.
(b) Erbium fiber used as an amplifier
It is possible to predict the gain across wavelength of an (Erbium Doped Fiber Amplifier (EDFA) from the absorption and emission spectra of the fiber and a modelling tool such as GainMaster™ [21].
The control samples are the un-radiated sections of fiber and these are compared to the samples radiated at 200 Gray. The radiated sample can be seen to have higher background attenuation independent of wavelength.
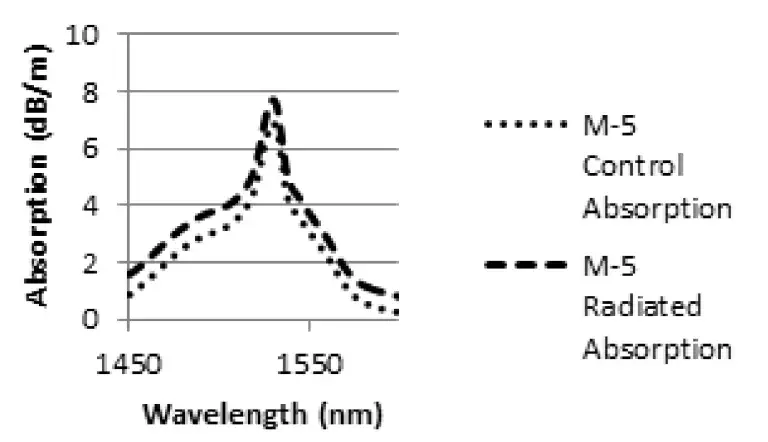
Figure 10: Absorption (left) and emission (right) spectra of the M-5 fiber.
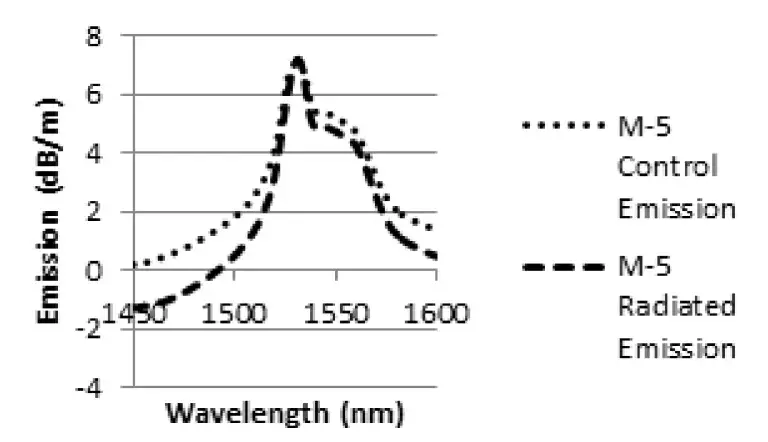
The emission spectra post irradiation has a tilt which is a regular artifact of the test and should be ignored. However, the emission spectra are slightly narrowed which has been seen by other authors [13]. The overall impact is minor and shows again that the Erbium is not largely affected by the radiation.
The most significant impact on gain of an EDFA (or output power of an ASE source) is the attenuation. Using the example of the M-5 fiber above, in a particular amplfying combination we have shown that for the optimum fiber length of 11.5m (derived from the control data) for 980nm pumping (or less length for 1480nm) the impact of the attenuation can be calculated.
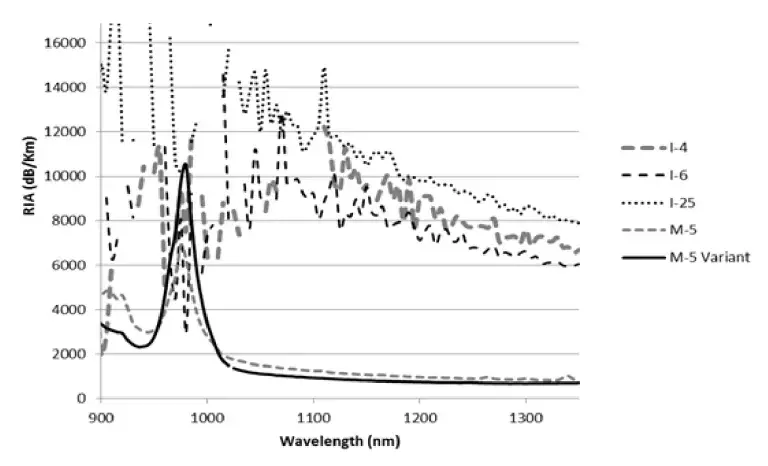
Figure 11: RIA of EDF showing the attenuation spectra.
| 11.5m length amplifier | 980nm pump (used 935nm for the excess loss) | 1480nm pump RIA | 1550nm signal RIA | Spectrum change |
|---|---|---|---|---|
| 200Gray (20years) RIA | 36dB | 9dB | 9dB | negligible |
| Gain drop due to 200Gray radiation | - | ~9dB | ~1dB | negligible |
| 20Gray (2years) RIA | 3.6dB | 0.9dB | 0.9dB | negligible |
| Gain drop due to 20Gray radiation | ~3dB | ~1dB | ~0.1dB | negligible |
These predictions are using dual (forward and counter) pumping but are approximate since the GainMaster™ tool is not very sophisticated, but the largest error is the uncertainty on photo-annealing (see further discussion below).
Annealing
The radiation induced color centers which give the RIA are annealed out by a number of mechanisms. One is thermal and hence the temperature of irradiation and storage following radiation are crucial. It needs a temperature of 300oC to anneal the damage totally [22], but a certain degree of annealing takes place at room temperature. The consequence of thermal annealing is that for very low dose rates (such as exist in space, as opposed to practical test rates) the RIA does not increase with increased total dose because the damage is being annealed by the ambient temperature as it is created [20].
Optical signals above 1µW can also cause annealing [23] which is called photo-annealing Any experiment where the fiber loss is being monitored live will be illuminated by an optical source and can demonstrate less attenuation as a consequence of the signal used.
In our live monitoring of the radiation tolerant fiber, we showed no impact of photo-annealing with 25µW of optical power, but there was clearly some annealing taking place when the gamma source was removed, hence this must have been purely thermal.
For the EDFs from the simulation above it can be seen that 980nm pumping is not practical at 200 Gray and even after 20 Gray. However, a typical pump laser power is at least 100mW, so the photo-annealing effect will be significantly stronger. For example, Peng [22] used a pump laser of 976nm and a power of 290mW. Over a period of 98 minutes, he saw a recovery of the 1310nm attenuation level, with some residual attenuation on the 980nm region. This followed a total dose of 1292 Gray which in a space environment would be accumulated over a period of many years - considerably longer than 98 minutes. Hence photo-anneal recovery would dominate the creation of further damage centers.
Dual pumping using both forward and counter pump lasers in the amplifier design will enhance the photo-annealing considerably since all of the fiber will see a higher power.
Using 1480nm pumping, the performance of the amplifier will be degraded considerably less but the photo-annealing, although lower, could also overcome the RIA totally [20].
Hence, despite the attenuation values measured, an ASE source or EDFA could be completely feasible in space. Further work with key parts on an amplifier, namely pumping the ~10m length of fiber during irradiation, will be needed to prove this.
Conclusion
We have shown that radiation tolerant PM fiber can withstand a total radiation dose in excess of 2000 Gray showing limited attenuation. This is 10 times the expected dose in a 20 year life in a geostationary orbit.
No impact of photo-bleaching was seen in radiation tolerant fiber at optical power levels which were less than 25μW at the total dose level of 200 Gray.
In EDFs, no strong dependency was found on Erbium concentration. However, there is relationship between co-dopant alumina alongside Erbium in generating RIA. The results showed promise for space applications.
In all of the fibers the RIA depends on the total of the dopants present and how they interact, hence fibers must be tested for confirmation of the impact of the environment. But there are enough trends with fiber families to be able to start at an optimum dopant combination in the design.
References
[1] “2011 Commercial Space Transportation Forecasts”, FAA Commercial Space Transportation (AST) and the Commercial Space Transportation Advisory Committee (COMSTAC), May 2011
[2] D. M. Sawyer and J. I. Vette, „AP-8 trapped proton environment for solar maximum and solar minimum“, NASA TM-X-72605, 1976
[3] J. I. Vette, „The AE-8 trapped electron model environment“, NSSDC/WDC-A-R&S, 91-24, 1991
[4] J. Lauenstein and J. L. Barth, “Radiation Belt Modelling for Spacecraft Design: Model Comparissons for Common Orbits“, Radiation Effects Data Workshop, pp. 102-109, USA, 2005
[5] R. H. Boucher, et al, „Proton-induced degradation in interferometric fiber optic gyroscopes“, Optical Engineering, vol. 35, no. 4, pp. 955-976, 1996
[6] T. J. Wijnands, et al, „Radiation tolerant optical fibres: from sample testing to large series production“, Journal of Lightwave Technology, vol. 29, no. 22, pp. 3393–3400, 2011
[7] E. Regnier, et al, „Low-Dose Radiatio-Induced Attenuation at InfraRed Wavelength for P-Doped, Ge-Doped and Pure Silica-Core Optical Fibers“, IEEE Transactions On Nuclear Science, vol. 54, no. 5, pp. 1115-1119, 2007
[8] C.E. Dickey, „Irradiation of Fiber Optics in the SSC Tunnel“, Superconducting Super Collider Laboratory Report SSCL-261, 1990
[9] S. Girard, et al, „Proton- and Gamma-Induced Effects on Erbium-Doped Optical Fibers“, IEEE Transactions on Nuclear Science, vol. 54, no. 6, pp. 2426-2434, 2007
[10] T.S. Rose et al, „Gamma and Proton Radiation Effects in Erbium doped Fiber Amplifiers: Active and Passive Measurement“ Journal of Lightwave Technology vol 19 no 12 December 2001
[11] H. Henschel, et al, “Radiation-induced loss of Rare Earth doped silica fibres,” IEEE Transactions on Nuclear Science, Volume: 45 Issue: 3, June 1998, Page(s): 1552 –1557.
[12] Berne et al A Model for the Prediction of EDFA gain in a Space Radiation Environment IEEE Photonics Letter Vol 16 no 10 October 2004
[13] OMERE http://www.trad.fr/OMERE-Software.html
[14] Foundations for Guided-wave optics, Wiley 2007 page 282 figure 11.4
[15] Fundamentals of Optical Fiber Communications p115 Prentice Hall 1991
[16] S Girard et al, “γ Rays and Pulsed X-Ray Radiation Responses of Germanosilicate Single Mode Optical Fibers:Influence of Cladding Codopants“ Journal of Lightwave Technology vol 22 no 8 August 2004
[17] J.E.Townsend et al, „Solution-doping technique for fabrication of rare-earth-doped optical fibres“ Electronic Letters (1987) vol 23 p329-331
[18] Speciality Optical Fibers Handbook Elsevier 2007 ed.Mendez Chapter 7 page 199
[19] M Ott „Radiation Effects Expected for Fiber Laser Amplifiers Rare Earth Doped optical Fiber” NASA 2004
[20] T. Rose, et al, “Gamma and Proton Radiation Effects in Erbium-Doped Fiber Amplifiers: Active and Passive Measurements,” Lightwave Technology, Journal of , Volume: 19 Issue: 12 , Dec. 2001, Page(s): 1918 –1923.
[21] Fibercore website http://www.fibercore.com/ first register and then download the application
[22] Peng et al “Photo-annealing Effects for Erbium doped Fibersources after Gamma Irradiation Tests by using 532nm and 976nm Lasers” Proc SPIE vol 7502 730375-1 20th Int Conf. Optical Fiber Sensors 2009
[23] M Ott “Radiation Effect Data on Commercially Available Optical Fiber: Database Summary” NASA 2002 http://radhome.gsfc.nasa.gov/radhome/papers/NSREC02_W5.pdf
Download Full White Paper
Complete the form below to download the white paper.