Abstract
To enable rapid development of new Fiber Optic Gyroscopes (FOGs), Fibercore have developed a new 60µm, ultra-low profile, high birefringence Polarization Maintaining (PM) fiber for FOGs. By optimizing the design parameters based on Fibercore’s significant experience in supplying the FOG industry with optical fibers, this fiber is shown to give enhanced mechanical reliability in a small coil diameters, improved bend loss, smaller physical size and equivalent Polarization Extinction Ratio (PER) performance over temperature as a standard 80µm FOG fiber. This allows FOG system designers to replace their existing 80µm fiber with the new 60µm fiber to gain extra sensitivity or to develop new micro-gyros.
Introduction
Significant investment has been made by Fiber Optic Gyroscope (FOG) manufacturers to design, develop and manufacture their FOG coils, to give highly accurate and high yielding products. Due to the financial and time costs in developing these technologies, FOG manufacturers are often reluctant to introduce new FOG products until significant return on investment has been achieved on existing product ranges. In recent years, a number of new FOG manufacturers have been able to break into the FOG market either in direct competition to the established FOG manufacturers or within niche markets. These newer companies approach the market with the latest technologies available, giving the more established companies a dilemma of either maintaining their older product designs and competing commercially or to develop new products to compete technically.
To enable both old and new FOG manufacturers to diversify their product range with minimal development effort, Fibercore have developed a new ultra-low profile, High Birefringence (HiBi) Polarization Maintaining (PM) fiber for FOGs. This 60μm cladding diameter fiber is designed to allow two major FOG designs to be realized. Firstly, an existing FOG design utilizing 80μm fibers can have the fiber exchanged for a 60μm fiber without the need to change the foot-print of the gyroscope. This allows a longer length of fiber to be used within the same mechanical layout, giving a higher sensitivity FOG. Figure 1 demonstrates the coil volume difference between using a 60μm or 80μm fiber. Secondly, the inherent design requirements (high Numerical Aperture (NA) and high Polarization Extinction Ratio (PER)) of a 60μm FOG fiber makes the fiber suitable for micro-gyros where ultra-small diameter coils are required.
FOG applications require highly technical optical fibers where almost every fiber parameter has an impact on the FOG performance. Finding the right balance between these parameters and understanding the final application is critical in developing any fiber for the FOG industry. In this paper, a range of fiber design parameters are discussed to help explain the methodology in designing Fibercore’s HB800G(3.4/60) 60μm cladding diameter fiber and experimental results are shown to prove the high performance levels capable of this fiber.
Subscribe for Insights!
Register to receive Fibercore's latest key updates, events and relevant industry news
straight to your inbox!
Bend Loss
For a FOG, it is a critical design feature to fit a maximum length of fiber within the smallest volume possible. Subsequently, this leads to the fiber coils requiring small inner diameters. The small diameter of the coil has an effect on both the bend loss and reliability of the fiber. These effects need to be considered for all grades of gyroscope. Whilst tactical grade gyros typically use shorter lengths of fiber, they often use smaller coil diameters than higher accuracy gyroscopes which may use up to 5km per axis. Therefore any advantage gained in using a shorter length of fiber is often counteracted by having a tighter coil diameter.
Bend loss is the reduction in optical power due to bends in the fiber. When the fiber is bent, a stress gradient is formed across the fiber which effectively alters the Refractive Index Profile (RIP) of the fiber, which results in reduced guidance of the core mode. The reduced guidance of the core mode means that some of the light from the core escapes into the cladding of the fiber, where the light is unguided and is eventually absorbed into the coating of the fiber. As the bend diameter reduces, the stress on the fiber increases and the bend loss increases exponentially. To reduce the bend loss, the fiber can be designed to have stronger confinement of the core mode, reducing the effect of bend loss. This is achieved through increasing the NA of the fiber, typically through increased germanium doping of the core. This raises the refractive index of the core relative to the cladding and confines the optical mode more tightly within the core of the fiber.
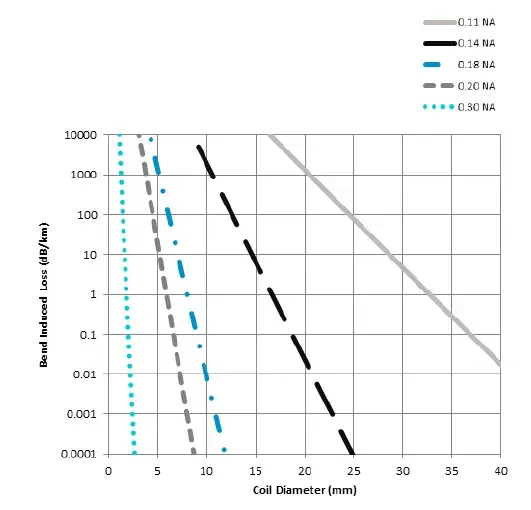
For a fiber with an NA of around 0.20, it is theoretically possible to coil 1km of fiber in a 10mm diameter with only 0.0001dB bend loss. However, it is worth noting that gyro coils are never perfect. Typically, most coils are made up of multiple layers of fiber which causes micro-bends at the points where the fiber from one layer crosses over a fiber from another layer. These micro-bends cause localized stresses on the fiber and small bend diameters which ultimately results in extra loss of the optical power. Again, the higher NA helps to reduce the effects of these micro-bend induced losses in a similar way to preventing the macro-bend (larger diameter) losses.
The bend loss may be calculated to find the most suitable NA for a FOG fiber. Jeunhomme [1] defines the equation for bend loss as:
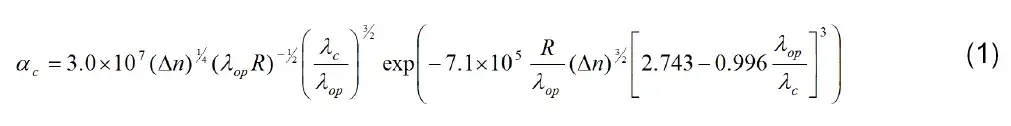
Where ac is the constant curvature loss, Δn is the core-cladding index difference, λop is the operating wavelength (in μm), R is the radius of curvature and λc is the cut-off wavelength of the LP11 mode (in μm).
For a FOG designer, it is important to maintain a high dynamic range on the power output from the fiber coil. This gives a higher Signal to Noise Ratio (SNR) and allows for more accurate measurements. Figure 2 can be used to give design guidance as to what level of NA is required to overcome the macro-bend loss related to the coil diameter.
The designed cut-off wavelength can also be used to control the level of bend loss within a coiled fiber. The closer the cut-off wavelength is to the operating wavelength, the better the confinement of the core mode and subsequently the lower the bend loss. However, bend loss is a stronger function of NA than of cut-off wavelength, so the primary consideration is for NA.
Splice Loss
Increasing the NA to reduce the bend loss is extremely useful for a FOG designer, but it does have a negative effect as the NA is increased, the Mode Field Diameter (MFD) is reduced. This makes achieving a low splice loss more difficult, particularly for PM fibers. Two main factors effect splice loss: core offset and different sized MFDs. A simple viewpoint for calculating the effect of the core offset is to calculate the core area overlap integral. For higher NA fibers, where the MFD is smaller, a small core offset between the two fibers will cause a relatively large reduction in the overlap integral, which would result in high splice loss. For lower NA fibers with larger MFDs, the same miss-alignment gives a larger overlap integral which, providing a lower splice.
Core offset is particularly important for splicing PM fibers where a side-view alignment technique is typically used for aligning the fibers. In this situation the cores are not actively aligned, therefore they could be miss-aligned by the total of the offset caused by the core concentricity of both of the fibers. For example, for two 3.5μm MFD fibers being spliced with a 0.5μm total core offset, the maximum possible splice loss would be 1.24dB, but for two 5.0μm MFD fibers, this maximum splice loss would be 0.87dB. However, this calculation only considers butt-coupling the fibers and does not consider any splice effects which will give an improved splice loss (these values are worst case scenario values). It is also worth noting that it is possible to use splicers to automatically align the cores of the PM fibers using ‘active alignment’, where light is launched into one end of the splice and a power meter connected to the splicer is connected to the other end of the coil. The splice machine can read the power meter during the fiber alignment until the point of maximum optical power is detected, which is the point at which the two cores are best aligned. Using active alignment dramatically reduces the splice losses caused by core concentricity.
Splice loss is also increased where two fibers with different NAs are spliced together. The cause of the loss is due to the lower NA fiber not being able to accept all of the angles of light which can be guided within a higher NA fiber. Therefore a proportion of the light is lost within a short distance after the splice. It is advisable to choose fibers throughout the entire FOG system which have identical NAs or as close to identical NA as possible. It is for this reason that Fibercore provide a full range of PM and SM fibers with various NAs, allowing flexibility to choose the best fibers for the sensing coil, light sources, couplers and modulators to help optimize the performance of the FOG.
Mechanical Lifetime
Whilst bend loss is a well understood effect within optical fibers, mechanical lifetime is often overlooked or poorly understood. When a fiber is coiled, there is a finite lifetime to the fiber. Failures can occur over time and do not occur instantaneously. The smaller the coil diameter, the higher the probability that the fiber will fail. There are many different models for the mechanical lifetime of a coiled fiber, at Fibercore the COST-218 model is used.
To improve the mechanical reliability of a fiber in a gyro coil, a designer has four options: make the coil diameter as large as possible (although this is often not an option as reduced volumes are critical design factors for most designs), use a reduced cladding diameter fiber (using an 80μm or even a 60μm cladding diameter fiber gives significant improvement to the reliability) and have the fiber proof tested to greater than 1% (typically most FOG applications have the fiber proof tested to 2%) and reduce the length. The effect of changing these parameters can be calculated using equations (2) to (5).
By rearranging Griffioen’s equations [2], the COST-218 mechanical lifetime model can be defined as:

Where: σa is the applied in-service stress (in GPa), σp the proof test stress (in GPa), ta is the time for which in-service stress is applied (in seconds), tp the proof test dwell time (in seconds), n the stress corrosion susceptibility constant, L0 is the gauge length for which Weibull probability constants are defined (this is the gauge length in the dynamic strength measurement, measured in meters), L0 the total fiber length coiled (in meters), F the failure probability and m the Weibull shape constant for inert strength distribution.
σa, the applied in-service stress, is the stress induced by the bending of the fiber where a stress gradient is applied across the core and cladding of the fiber. The fiber surface, which is closest to the inside edge of the curvature is under compression and the fiber surface on the outer most edge is under extension, this gives the stress gradient. σa can be defined as:

ɛ is the strain, E Young’s modulus (73GPa for silica fibers), r the fiber radius, R the bending radius and Cth the coating thickness.
The product BS0 in equation (2) may be approximated by:
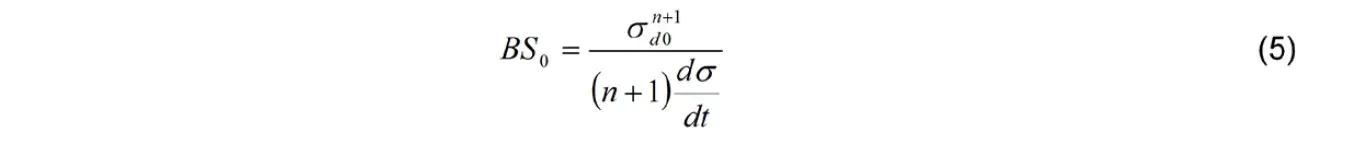
Where: σdo is the Weibull scale constant for the dynamic strength distribution and dσ/dt the dynamic stress rate.
The COST-218 model may be applied in two ways:
1. To predict the probability of failure within a period of time given a known coil diameter.
2. To predict the time at which the first failure will occur.
By rearranging equation (2) and using the results from mechanical fiber measurements at Fibercore, the expected mechanical lifetime of the fiber under different deployment states is graphically shown in Figure 3. These graphs assume 1,000 meters of fiber is used with a failure rate of 1x10⁻⁵ (otherwise stated as 1 in 100,000 or 1:100,000).
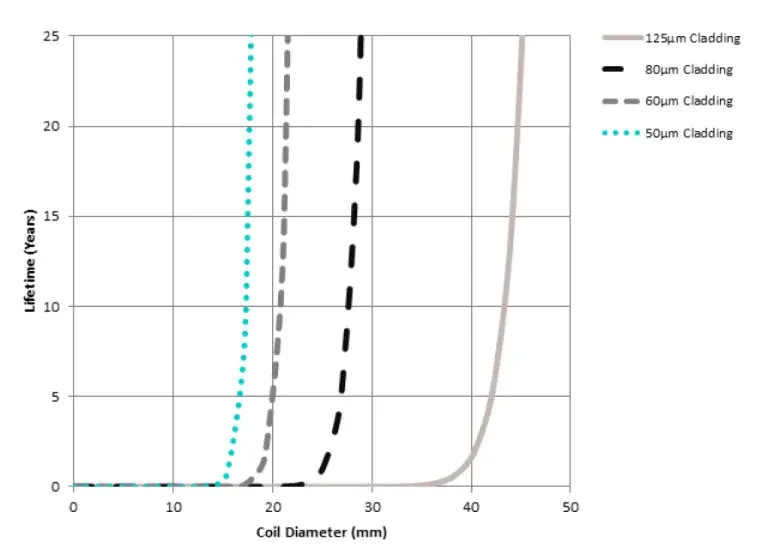
Figure 3: Lifetime as a function of coil diameter, shown for different cladding diameter fibers where 1,000m of fiber is used with a failure rate of 1 in 100,000 and a 1% proof test.
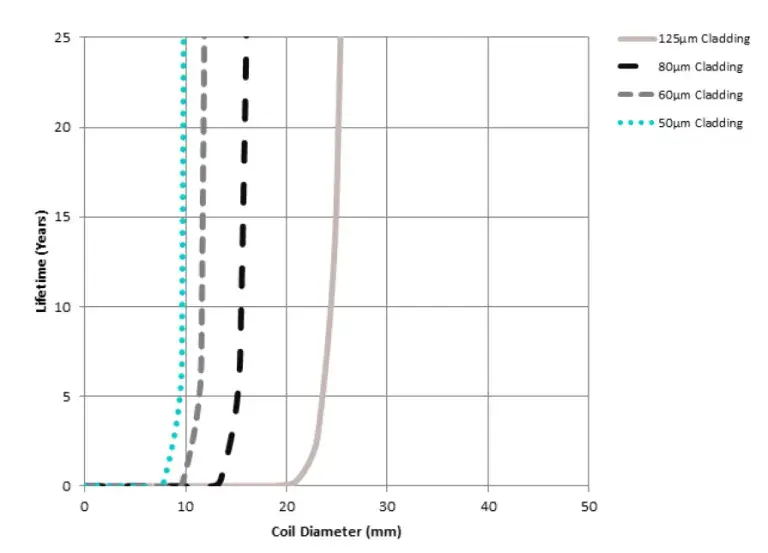
Figure 4: Lifetime as a function of coil diameter, shown for different cladding diameter fibers where 1,000m of fiber is used with a failure rate of 1 in 100,000 and a 2% proof test.
It is clear to see that the smaller the diameter of the fiber cladding, the smaller coil diameters that can be achieved to maintain the same mechanical lifetime. For example, if 100,000 units were manufactured with a 125μm fiber with 1km of fiber tested at a 1% proof test and the fiber was coiled to a 40mm diameter, then you would expect one coil failure every 2 years. However, for a 60μm fiber, you would expect zero failures in over 25 years. Reducing the cladding diameter creates a large improvement in the predicted mechanical lifetime as the weaker fibers would be detected early through the 2% proof test. Similarly, an improvement in lifetime can be made thorough increasing the proof test of the fiber as shown in Figure 4.
By increasing the proof test, the probability of failure of the coils is reduced, giving longer predicted mechanical lifetimes and reducing the risk of failure for small coil diameters. For high reliability applications, such as FOGs in the aerospace and marine industries, it is generally recommended to use a 2% proof test.
Stiffness & Birefringence
Reducing the cladding diameter of the fiber gives two major benefits: the gyro coil will have a longer mechanical lifetime and more fiber can be used within the same volume. This allows more accurate FOGs to be designed without changing the footprint of the gyro.
However, by reducing the cladding diameter, the stiffness of the fiber is reduced. This means the fiber will bend more easily, providing less mechanical resistance to external pressures, for example at cross-over points. The stiffness of the fiber is proportional to the diameter of the fiber to the fourth order. Reducing the cladding diameter can have a major effect on the opto-mechanical performance of the fiber, unless significant changes are made to the birefringence and NA of the fiber. Figure 5 shows the relative diameter size of a 125μm fiber, 80μm fiber, 60μm fiber and a human hair for comparison.
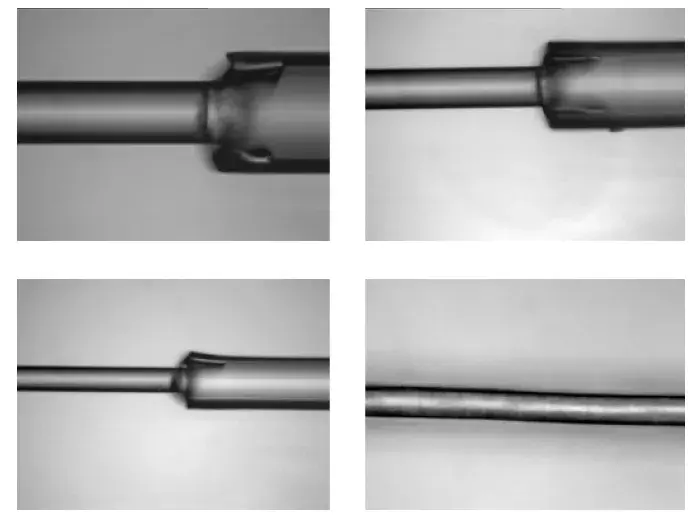
Figure 5: Microscope photos showing a 125μm cladding diameter fiber (top left), 80μm cladding diameter fiber (top right), 60μm cladding diameter fiber (bottom left) and a human hair bottom right.
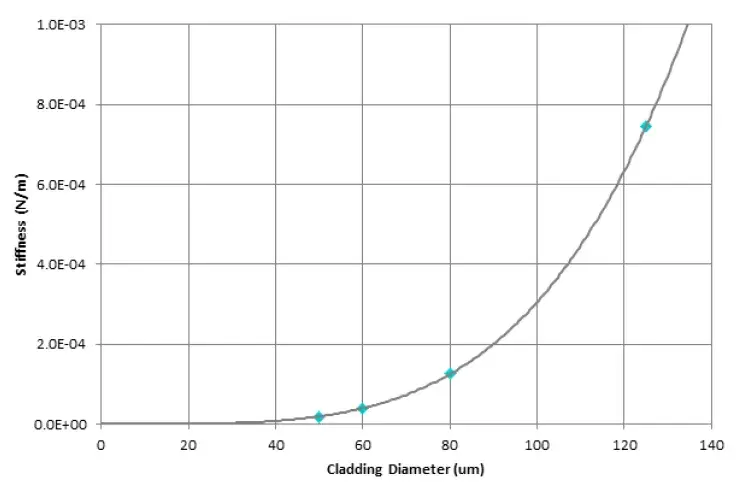
Figure 6: The effect of cladding diameter on the stiffness of an optical fiber.
The reduced stiffness makes the fiber more susceptible to micro-bends which can lead to increased optical scattering points. These optical scattering points cause two effects within a PM fiber, reduction in optical power due to out coupling of some of the fundamental mode to the cladding (similar to macro-bend loss) but significantly for a PM FOG, cross-coupling of light from one polarization axis to the other can occur. This cross-coupling effect will reduce the PER of the system, resulting in lower accuracy results. Subsequently, the fiber design for reduced cladding diameter fibers is guided towards high NAs and very high levels of birefringence to overcome degradation in performance related to the reduced mechanical stiffness. Figure 6 shows the calculated stiffness of different diameter fibers, showing the reduction in stiffness as the fiber diameter reduces.
The first 60μm fiber has been developed for use around 830nm rather than 1550nm as the core size (and MFD) of a fiber designed for 830nm is smaller than is required for a 1550nm fiber, which will give improved mechanical isolation from scattering points. The reduced core size of the 830nm fiber means that the MFD extends a smaller distance within the cladding and so is less susceptible to stress gradients across the fiber than the 1550nm fiber. It is expected that a 1550nm fiber would not perform as well with regards to PER.
Experimental Results
The ideal way to test any gyroscope fiber would be to test it in a high accuracy gyroscope coil, although this is typically not possible for most fiber manufacturers. Even if this is possible, the quality of FOG coil is strongly dependent upon the winding and potting techniques used by the FOG manufacturer. A coil from one manufacturer is unlikely to give the same results as a coil from another manufacturer, so the results would only be indicative at best. As Fibercore do not have a high accuracy gyroscope coil winder, we have taken the approach to use a ‘Basket Weave’ to give statistically useful results.
Basket Weave
To provide meaningful measurements, Fibercore use a ‘Basket Weave’ technique where 400m long lengths of fiber are coiled onto an aluminum spool with 14g tension. Whilst the ideal test would be to wind a high accuracy gyro coil under a lower tension, Fibercore’s equipment is not capable of winding to these levels. Therefore we use a purposefully bad winding technique to help ensure that all coils are repeatable. This prevents the situation where some spools are randomly good and some are randomly bad, which would give a large variation from test to test. By encouraging poor accuracy winding and maximizing the cross-overs, statistically the PER results become meaningful and repeatable. Figure 7 and Figure 8 show the surface of a completed 400m basket wind coil with an uneven surface demonstrating the inaccuracy of the wind. The IEC 62221 guidance for basket winds is to use lengths above 2.5km t oget consistent measurements of power penalty [3]. However, the PER penalty at 2.5km is too large, therefore a shorter length of 400m per coil is used in Fibercore’s tests to give a good balance of enough fiber cross-overs for statistically repeatable results and a high dynamic range on the PER to allow full comparative measurements. For more information on basket weaves, please refer to [4].
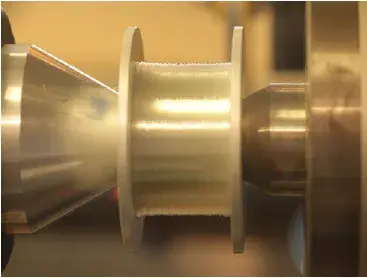
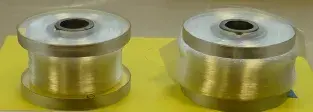
Figure 7: 400m basket weave coil on a 40mm spool.
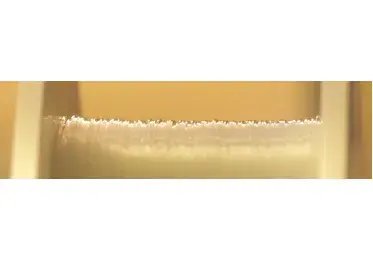
Figure 8: Showing the same basket wind as in Figure 7 but zoomed in on the surface of the fiber. It is clear to see that the forced inaccuracy of the wind creates major inaccuracies in the wind which will encourage cross-over points that will force relatively strong cross-coupling points.
PER Penalty Test
Two different fibers were chosen for a basket weave PER penalty test to see how much PER is lost by coiling the fibers into a small coil. These fibers were the new 60μm cladding diameter HB800G(3.4/60) and the established 80μm cladding diameter HB800G-SB, fiber parameters shown in Table 1. The HB800G-SB is an established design used in the FOG industry, so gives a benchmark for the PER penalty tests.
| Parameter | HB800G(3.4/60) | HB800G-SB | Unit |
|---|---|---|---|
| Attenuation at 830nm | ≤ 5 | ≤ 5 | dB/km |
| Beat Length at 633nm | ≤ 0.65 | ≤ 1.2 | mm |
| Coating Diameter | 114 - 126 | 162 – 179 | μm |
| Cut-Off Wavelength | 700 - 790 | 660 - 800 | nm |
| Fiber Diameter | 59.0 – 61.0 | 79.0 – 81.0 | μm |
| MFD | 3.4 | 4.2 | μm |
| NA | 0.18 – 0.22 | 0.14 – 0.18 |
The fibers chosen were a short beat-length 80μm HB800G-SB with a beat-length of 1.1mm at 633nm and a 60μm HB800G(3.4/60) with a beat-length of 0.9mm at 633nm. These two fibers were chosen to be roughly comparable in beat-length to allow the birefringence to be removed as a variable when comparing the results. Three different diameter spools were wound with each fiber at diameters of 15mm, 20mm and 40mm. After winding the spools using the basket weave technique, the PER penalty was measured three times for each spool, the results are shown in Figure 9.
For smaller spool diameters, the PER penalty of the 60μm is comparable to the 80μm fibers. At larger spool diameters, the 60μm fiber has marginally lower performance but this may be within experimental errors.
Thermal Testing
To thoroughly test the PER capability of the 60μm fiber, a HB800G(3.4/60) coil was tested between -40oC and +85oC. This thermal cycle was repeated three times with the PER and temperature constantly recorded, as shown in Figure 10.
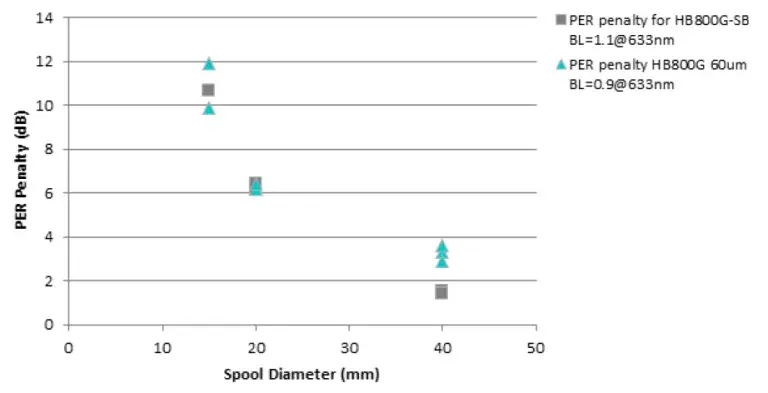
Figure 9: PER penalty when the fibers are basket wound onto 40mm, 20mm and 15mm diameter spools.
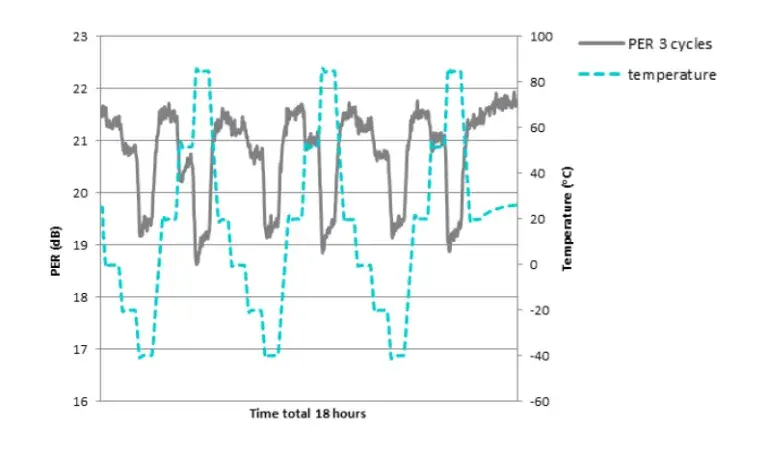
Figure 10: PER results and oven temperature of HB800G(3.4/60) over three temperature cycles between -40oC and +85oC.
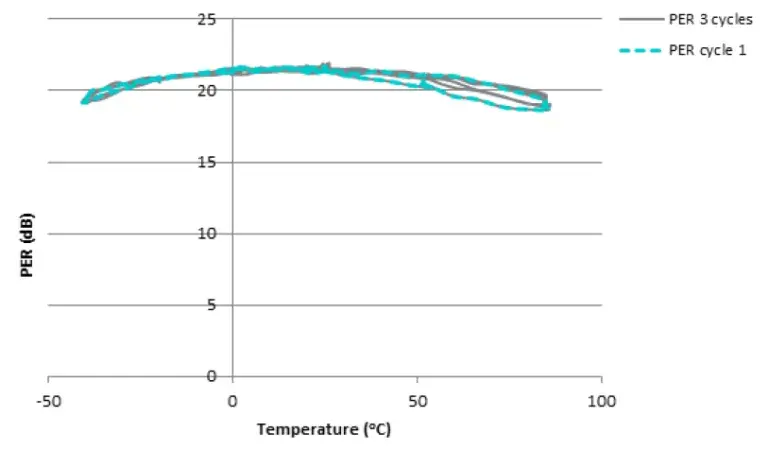
Figure 11: Temperature performance of HB800G(3.4/60) on a 40mm spool.
To better analyze the results, they are plotted as temperature against PER in Figure 11. This gives a good indication of the change in PER, showing that the PER degradation at the high and low temperature regions was minimal. On the first thermal cycle, a lower PER was shown at higher temperatures but on the second and third thermal cycle, the PER increased by approximately 1dB, the cause of this change is due to the fiber moving within the coil over temperature cycling. For this particular coil, the fiber moved into a position which created less micro-bends and so increased the PER. The measurements were made on a 40mm spool rather than the 15mm spool as Fibercore have comparative measurements from other gyroscope fibers on the 40mm spool. The HB800G(3.4/60) showed comparable performance over temperature as previously tested Fibercore gyroscope fibers.
Conclusion
Fibercore have developed a 60μm PM fiber, optimized for use in FOGs. The fiber has been designed to give the best possible bend loss and PM performance, such that the reduced diameter fiber is capable of giving comparable performance to existing 80μm PM gyroscope fibers. This allows FOG designers to use a 60μm fiber in their existing 80μm gyroscope designs, without the need to change the footprint of their system. Equally, this fiber also leads the way for PM micro gyros to be developed.
References
[1] L. Jeunhomme, “Single-Mode fiber Design for Long Haul Transmission”, IEEE Journal of Quantum Electronics, Vol. QE-18, No. 4, pp. 727-732, 1982
[2] W. Griffioen, “Mechanical Lifetime Model for Optical Fibers in Harsh Environments”, SPIE, Vol. 1973, pp. 150-160, 1973
[3] “Optical fibers – Measurement methods – Microbending sensitivity”, IEC 62221, Ed. 1.0 b:2001
[4] S. Jang, et Al, “Fundamental Mode Side and Bend Sensitivity of Graded and Step-Index Single-Mode Fibers with Zero-Dispersion Near 1.5μm”, Journal of Lightwave Technology, Vol. LT-2, No. 3, pp. 312-316, 1984
Download Full White Paper
Complete the form below to download the white paper.